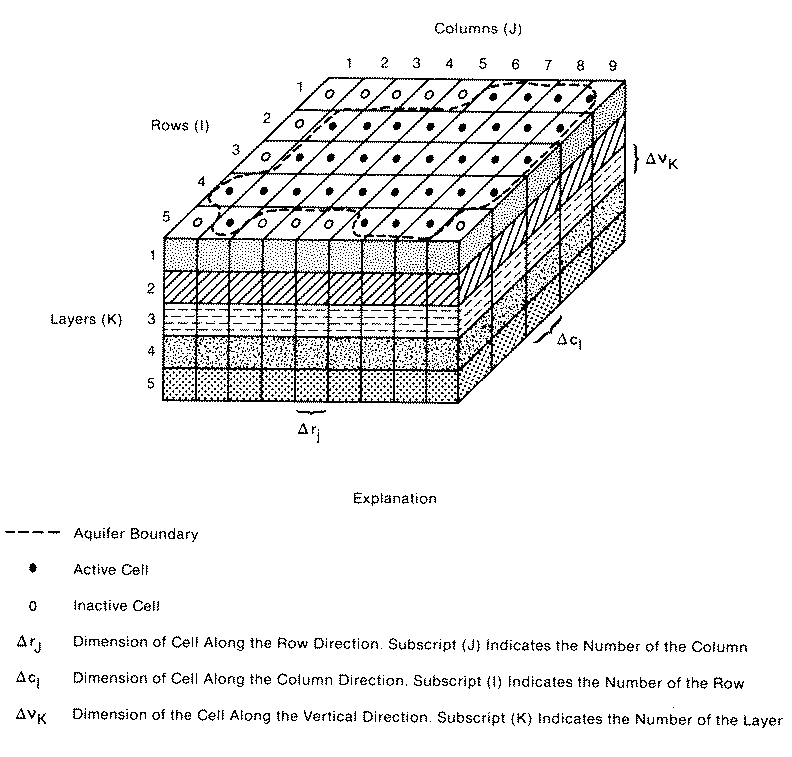
If you haven't seen a representation of a numerical model, this simple diagram demonstrates that we divide space into pieces so as to define one value for each geohydrologic parameter to represent the piece. (e.g. one value of K and S is defined for each piece and one value of head and flow is calculated for each piece).
Notice that complex geologic material distributions are simplified. They can be made more complex than illustrated here, but they do not approach the level of complexity we observe in the field. This model shows that each layer is similar throughout but that is not the norm. Usually properties will vary across the layers.
Also notice that some of the model pieces are defined as inactive (open circles). In this way we can take the rectangular form of the mathematics and create an odd shaped geometry. The inactive indicators may continue down through every layer of the grid, or not. If the aquifer is bowl shaped then some pieces that are active in the shallow layers would be specified as inactive in the deeper layers.
Item by item we choose numbers to define a conceptual object like the grid shown below to represent the geometry, properties, boundary conditions, initial conditions and stresses on a groundwater system to build a representation of field conditions.
