- Specify what model results to
analyze (include a check next to “CBC Files” to allow viewing of the mass
balance)
- Be wary that the proper path and file names appear here
- You can get to this screen to import any previously created results via Plot>ImportResults
- Click OK
- Check the model is doing what you expect by reading through the output, by dragging t2.out into textpad
if so, check the mass balance (either in t2,out, or by Plot>MassBalance>ModelSummary, if it is not acceptable- Select Model->MODFLOW->SolverPackage
- Decrease the tolerance, possibly increase the number of iterations if almost all were used last time
- Repeat creation of MODFLOW files and execution until convergence with reasonable mass balance is concerned
- Be wary that the proper path and file names appear here
Select Plot>Contour>Parameters(plan) and adjust contours as desired
Mine look like this:
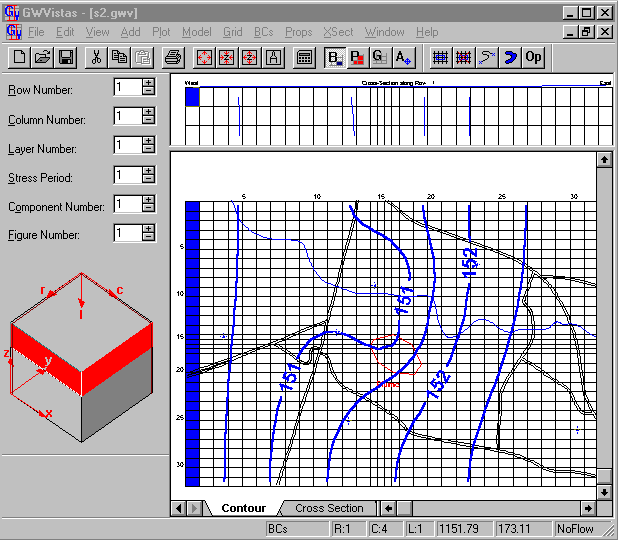
Toggle through the layers to see how heads change with depth
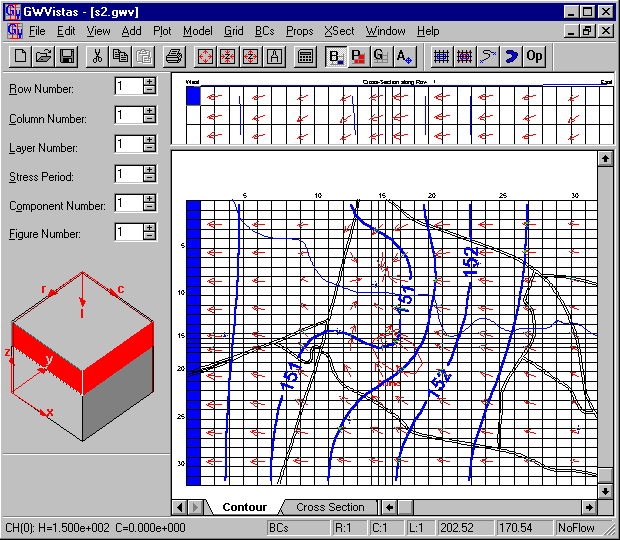
Plot velocity vectors on the map and cross-section by selecting
Plot->What to Display…
Check Vectors
Select Plot>VectorOptions to adjust the appearance of the vectors
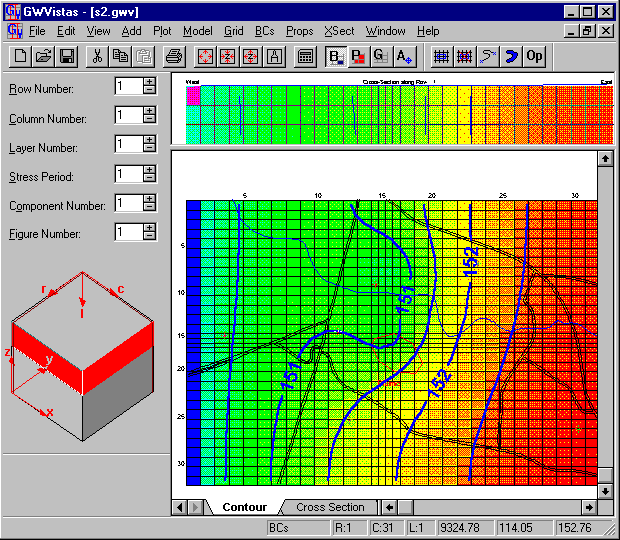
Plot a color flood map by selecting
Plot->What to Display…
Check Color Flood
Take a closer look at the cross section view
- Drag the bar that separates the cross
section from the plan view down
- Select Plot>Contours>Parameters(Section)
- Consider the calculated Z range (in this case heads)
- Set the contour controls at reasonable values
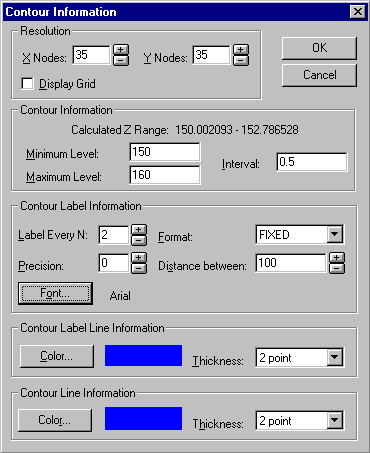
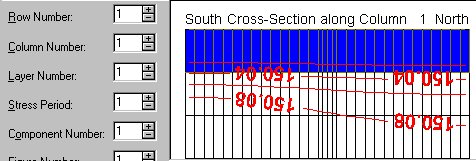
To obtain for row 1
- Select Plot>Contours>Parameters(Section)

To view along columns rather than rows Select XSect>Selection
- Adjusting for column 1
Try viewing color floods and vectors
- Adjust parameters controlling the contours and the size of vectors appropriately each time until you have a good "feel" for the flow system
- My view along row 8 is
- Adjust parameters controlling the contours and the size of vectors appropriately each time until you have a good "feel" for the flow system

Explore GWV plotting feature:
- To view the Mass Balance, Select Plot->Mass
Balance->Model Summary
- A table similar to the MODFLOW output summary appears
- Click Graph to produce a bar chart of the mass balance
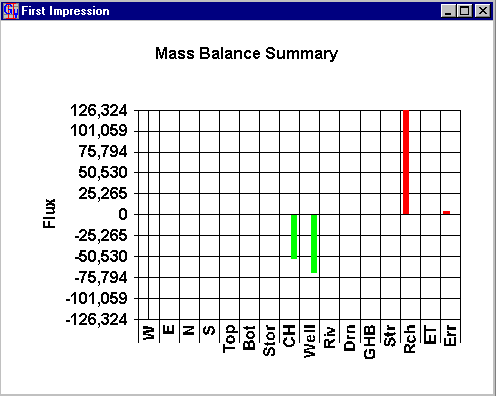
Flux rates are also displayed on the status bar based on cursor position
- Switch to the BC mode
- Switch to layer 1
- Place the cursor over a constant head cell
- The negative represents flow leaving the model
- Place the cursor over a constant head cell
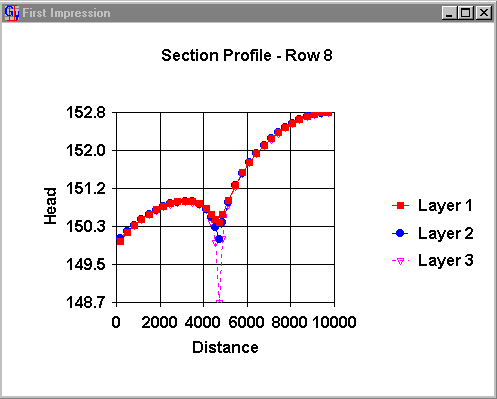
To view profiles of head, concentration, drawdown, or water flux plotted versus distance along a cross-section,
- Select Plot-> Profile->Head
- Double click on items such as axis labels to change to desired settings
- Right click on the graph to print, export, or modify the chart.
- Here is my profile for row 8
- A table similar to the MODFLOW output summary appears