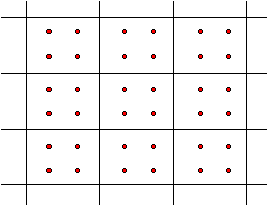
Initially packets are placed in cells These may have various configurations and numbers depending on the code and the user selections.
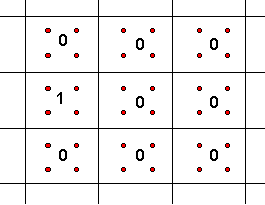
Let us say the concentration initially assigned to the packets is 1 ppm in the middle left cell and zero elsewhere.
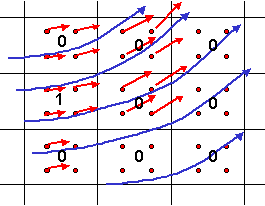
The MOC (methods of characteristics) code will have an algorithm for determining the local velocity of each packet (usually a bilinear interpolation of velocity at the cell interfaces). Given a defined time step, which may be user selected or controlled by the code, the packets will travel the distance equal to velocity times time. Depending on the velocity field this may differ for different packets.
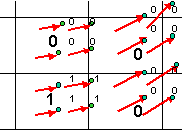
- Zooming in on the upper left corner
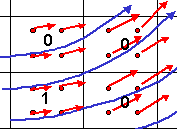
New particle locations with old concentration assignments:
without the velocity vectors and still with old concentration assignments:
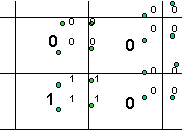
Given that some of the packets with concentrations of one advected into the next cell, the average concentration in that cell has changed due to advection. All the other cells still have all packets with either 1 or 0 concentration and so their average concentration did not change.
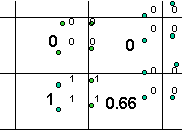
Zooming out to look at the "bigger" picture we see the average concentration due to advection in each cell. Notice that, as yet the curve in the flow field has not been captured.
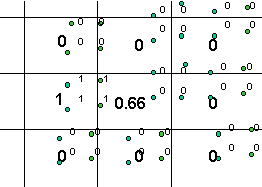
Deleting some of the detail AND averaging the concentration from the start and end of the time step to provide an intermediate concentration for the dispersion calculation:
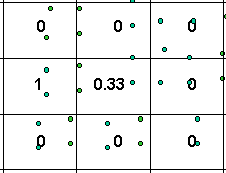
Using these average concentrations at each cell, the finite difference technique is used to calculate the dispersive portion of the problem (there are no source/sink, reaction or decay terms in this problem). The dispersive portion of the calculation does not "see" the curving flow field.
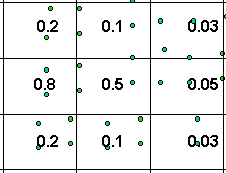
Using the change in concentration due to the dispersive step, the concentration of each packet is updated Recall that an increase in concentration and a decrease are treated differently.
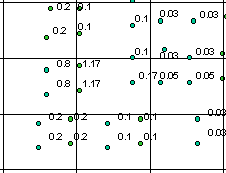
Then the concentration of each packet is averaged to obtain the new concentration for the cell at the end of the step. The process is repeated from there.
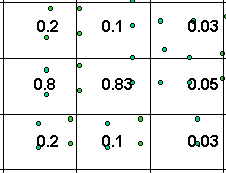
Another time step will be required before the curving flow field is registered.
Perhaps you can see the many issues that might arise, for example:- * the estimate of the velocity at a point in space
applying over a period of time
- * if the source were continuous, more packets would have to be added with time
GO "BACK" 3 TIMES to continue unit 13
OR GO "BACK" TWICE if you came from unit 14 and want to continue unit 14