- Specify what model results to
analyze (include a check next to “CBC Files” to allow viewing of the mass
balance)
- Be wary that the proper path and file names appear here
- You can get to this screen to import any previously created results via Plot>ImportResults
- Click OK
- Check the model by reading through the GWV output,
drag all the ex5 ascii files from C:\temp\yourname\modflow\exer\gwvtut into textpad
the binary files will appear as gibberish and can simply be closed if you open them
LET US TAKE SOME TIME NOW TO EXPLORE EACH FILE CREATED BY GWV AND EVALUATE WHETHER THE MODEL IS WHAT WE INTENDED
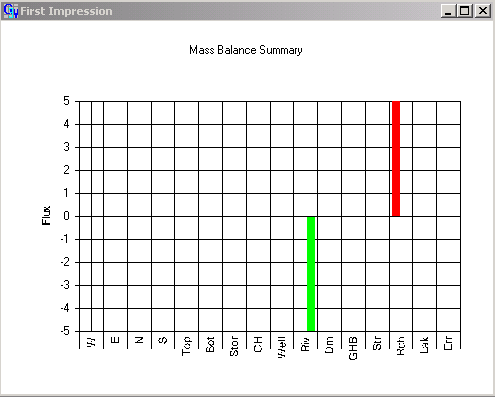
if your model did not converge, check the mass balance (either in ex5.out, or by Plot>MassBalance>ModelSummary),
if it is not acceptable:- Select Model->MODFLOW->SolverPackage
- Decrease the tolerance, possibly increase the number of iterations if almost all were used last time
- Repeat creation of MODFLOW files and execution until convergence with reasonable mass balance is concerned
- if you notice something incorrect, fix it, rerun and continue reviewing results
if you cannot figure out what is wrong, it may help to echo input to the output file
- Select Model->MODFLOW->PrintFormats
- Choose a print format for any parameter of relevance to your model (by default these are off, but if you are using my gwv file, they may be on)
Once these are checked, rerun and return to reveiwing your files
- Be wary that the proper path and file names appear here
Select Plot>Contour>Parameters(plan) and adjust contours as desired
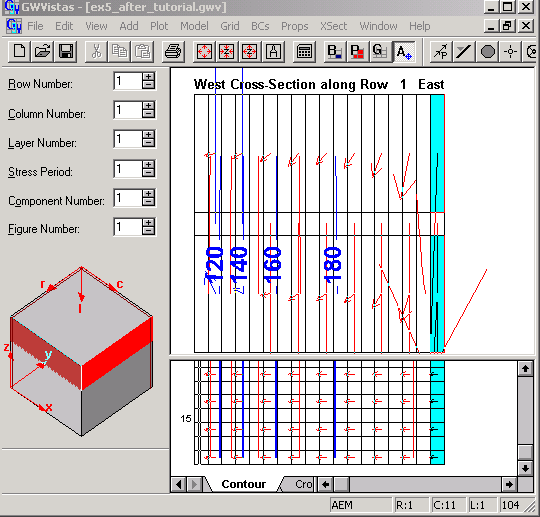
Mine look like this:
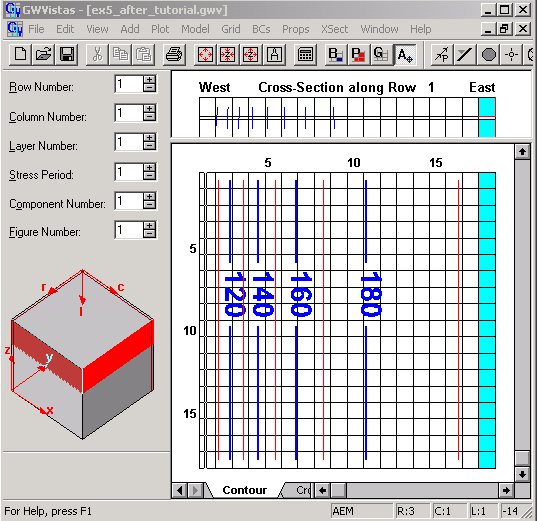
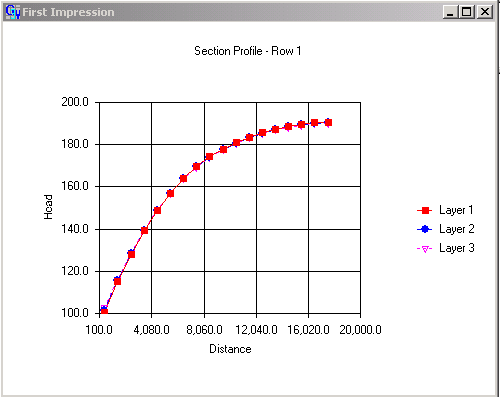
Toggle through the layers to see if heads change with depth
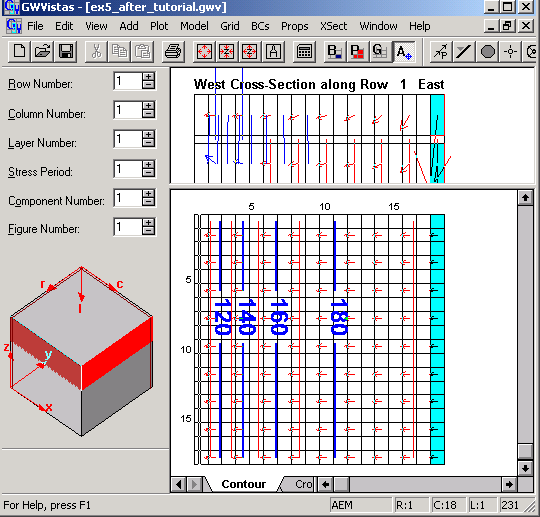
Plot velocity vectors on the map and cross-section by selecting
Plot->What to Display…
Check Vectors
Select Plot>VectorOptions to adjust the appearance of the vectors
Plot a color flood map by selecting
Plot->What to Display…
Check Color Flood of heads
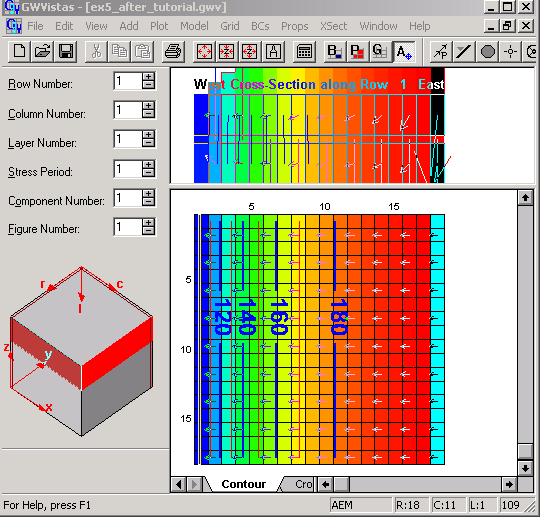
Turn off the color flood and take a closer look at the cross section view
- Drag the bar that separates the cross
section from the plan view down
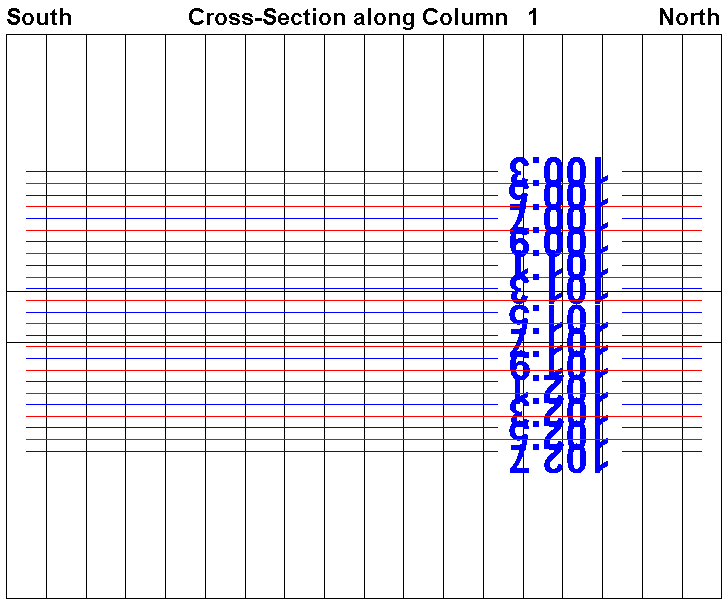
- Select Plot>Contours>Parameters(Section)
- Consider the calculated Z range (in this case heads)
- Set the contour controls at reasonable values
- Select Plot>Contours>Parameters(Section)
