Vibration analysis
The goal of this experiment is to characterize the vibrations in a beam. To do this you will need to create a setup to hold a flexible beam in place with the development board placed at the end. In the example photographed below, 3 plastic rulers form the beam, a pair of clamps holds the beam in place, and the development is held in place with rubber bands.

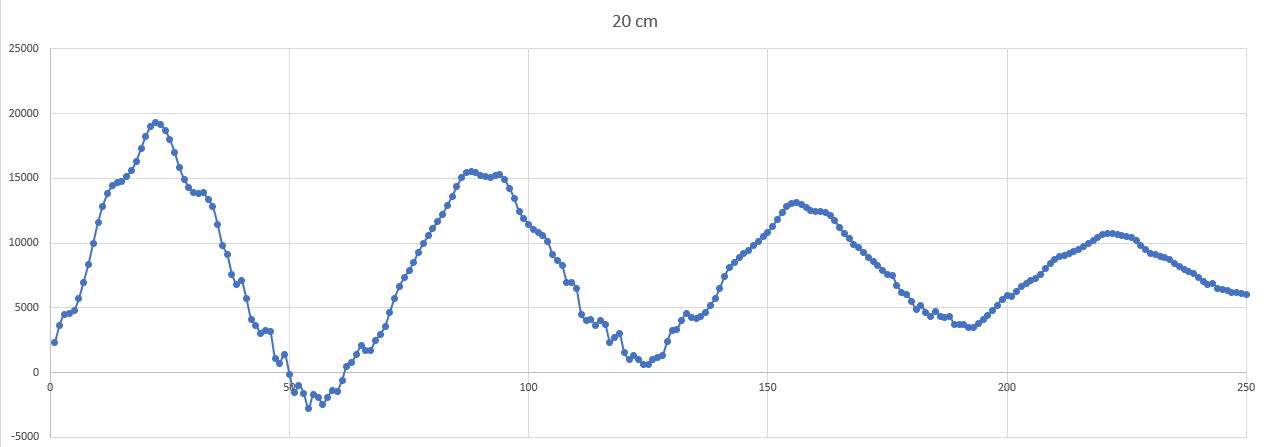
The advantage of using a ruler as the beam is that it comes pre-made with a scale attached, handy for the second component of this task. Once you have everything in place, pluck the end of the ruler, causing the development board to oscillate up and down, and record 512 samples acceleration samples. Cut and paste these samples into excel and plot them. In the example below, the ruler hung over the edge of my desk by 20 cm and I was recording samples every 5 ms.
From the sampling rate, you can determine the frequency of the oscillation. Repeat this experiment for different overhang distance and record the frequency of oscillation for each. Make a graph of the overhand distance vs. oscillation frequency.
Optional - Frequency Domain Modeling Use the information that you learned in EENG 307 to create a mechanical transnational model for the system with force as the input and the position of the accelerometer as the output. Use this model to get the transfer function Xout/Fin. Import this information into Matlab and use the impulse function to to simulate plucking the end of the ruler. Plot the output position vs time. Measure the mass of the development board and then adjust the damping and spring constants so that the Matlab plot agrees with the ruler at one of its positions. The relevant portion of Matlab code is shown below.
impulse(Xout,2)
grid on
ylabel('Acceleration')